HuntStand’s Whitetail Activity Forecast is a revolutionary tool ready to help deer hunters everywhere. What’s so special? Plenty. It utilizes the latest research on deer movements and proprietary rut data. The result is the ability to inform hunters when the highest periods of deer activity are likely to occur in their area. Even better, the forecast covers the next seven days, much like a weather forecast. So hunt planning is easier than ever, with dependable accuracy. The Whitetail Activity Forecast incorporates more than a dozen geographic, date, time, and weather variables. It makes use of thousands of data combinations — to give you every possible advantage during your time afield.

The Whitetail Activity Forecast was developed following months of research and collaboration with many of the most-respected whitetail experts.
How do you get it? The Whitetail Activity Forecast is one of the features available in the HuntStand Ultimate upgrade. This ground-breaking forecast, and feature-packed upgrade, is ready to benefit deer hunters nationwide.
Background and Development
The Whitetail Activity Forecast was developed by HuntStand Wildlife Biologist Brian Murphy, following months of research and collaboration with many of the most-respected whitetail experts in the United States. Prior to joining HuntStand, Brian served 23 years as the CEO of the Quality Deer Management Association (now the National Deer Association). With more than 30 years of research, management, and hunting experience throughout North America, Brian is widely regarded as one of the foremost authorities on white-tailed deer. He has published more than 100 deer-focused popular and scientific articles, and written several book chapters and training materials. He’s also filmed dozens of instructional videos and television shows, and is a regular radio and podcast guest. To bring the Forecast to life, Murphy worked closely with HuntStand Chief Technology Officer Jimmy Cleveland, an expert in mathematical modeling.
Upgrade to HuntStand Ultimate: Get the Whitetail Activity Forecast & More!
The Whitetail Activity Forecast Stands Alone
What makes HuntStand’s Whitetail Activity Forecast truly unique and superior to all other deer-movement tools? There are several factors, starting with its solid foundation in science. Also important, is that its results are tailored to each deer herd at the county, or even sub-county level. This results in the distinction of nearly 5,000 individual deer herds in the United States. In contrast, other deer-movement models apply a limited set of variables (e.g., weather or moon phase) to all whitetail herds. This makes their accuracy questionable at best.
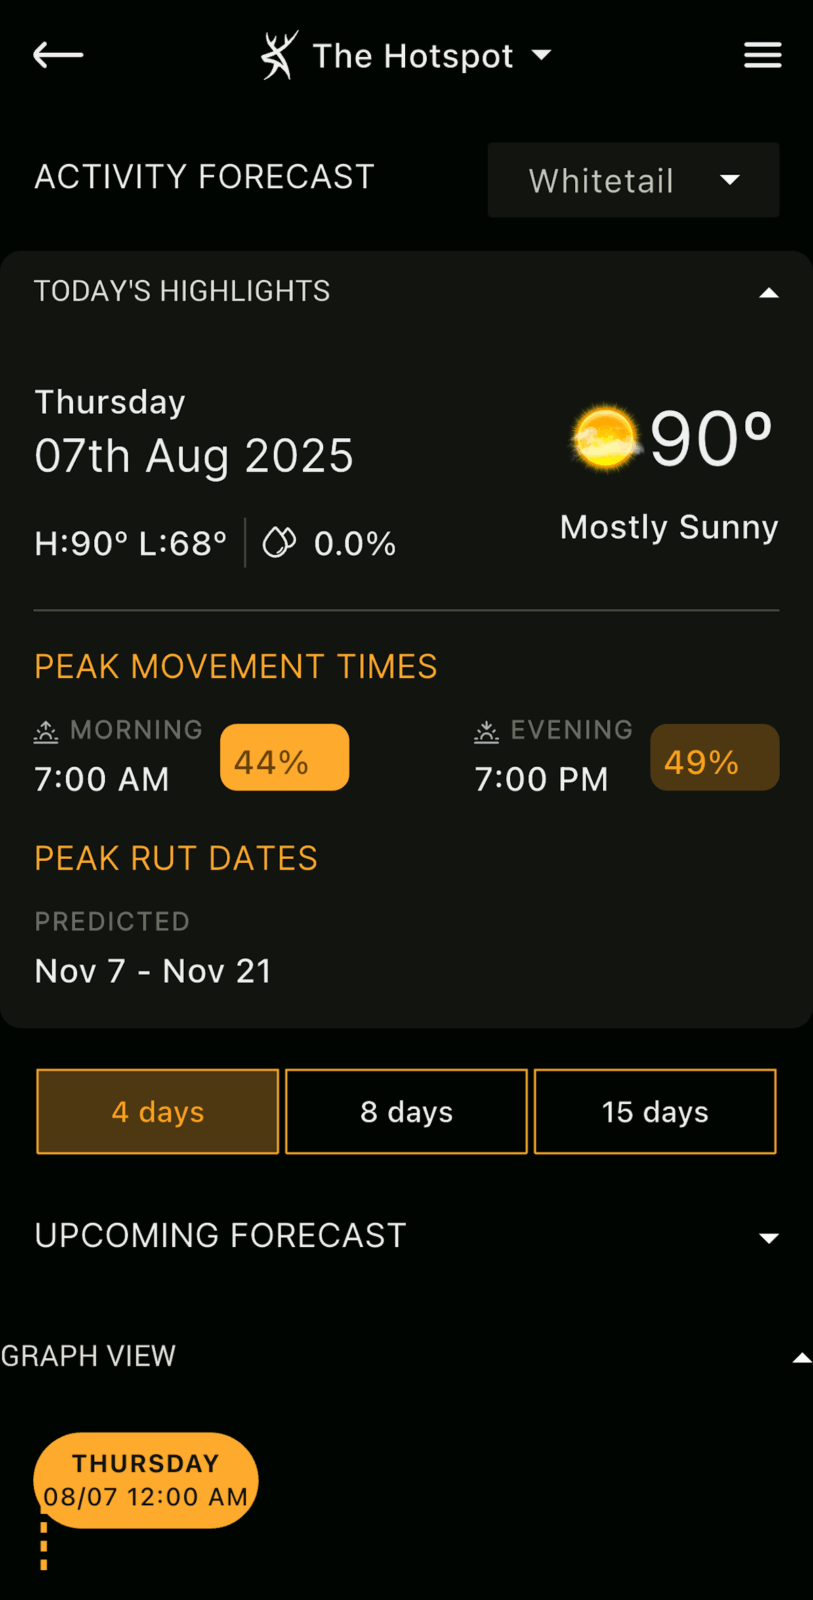
The first screen view (shown above) is divided into “Today’s Whitetail Activity Forecast” and a “15-Day Whitetail Activity Forecast.”
A key component of the Whitetail Activity Forecast is that it includes specific rut timing for each individual deer herd. This knowledge is essential for predicting deer movement. This is especially true given that the timing of the whitetail rut varies by more than seven months across the United States. This propriety herd- and rut-specific approach was made possible following the recent development of HuntStand’s Whitetail Rut Map. This equally ground-breaking tool identifies the peak rut periods to the county or sub-county level. And that’s across more than 98% of the whitetail’s range in the United States.
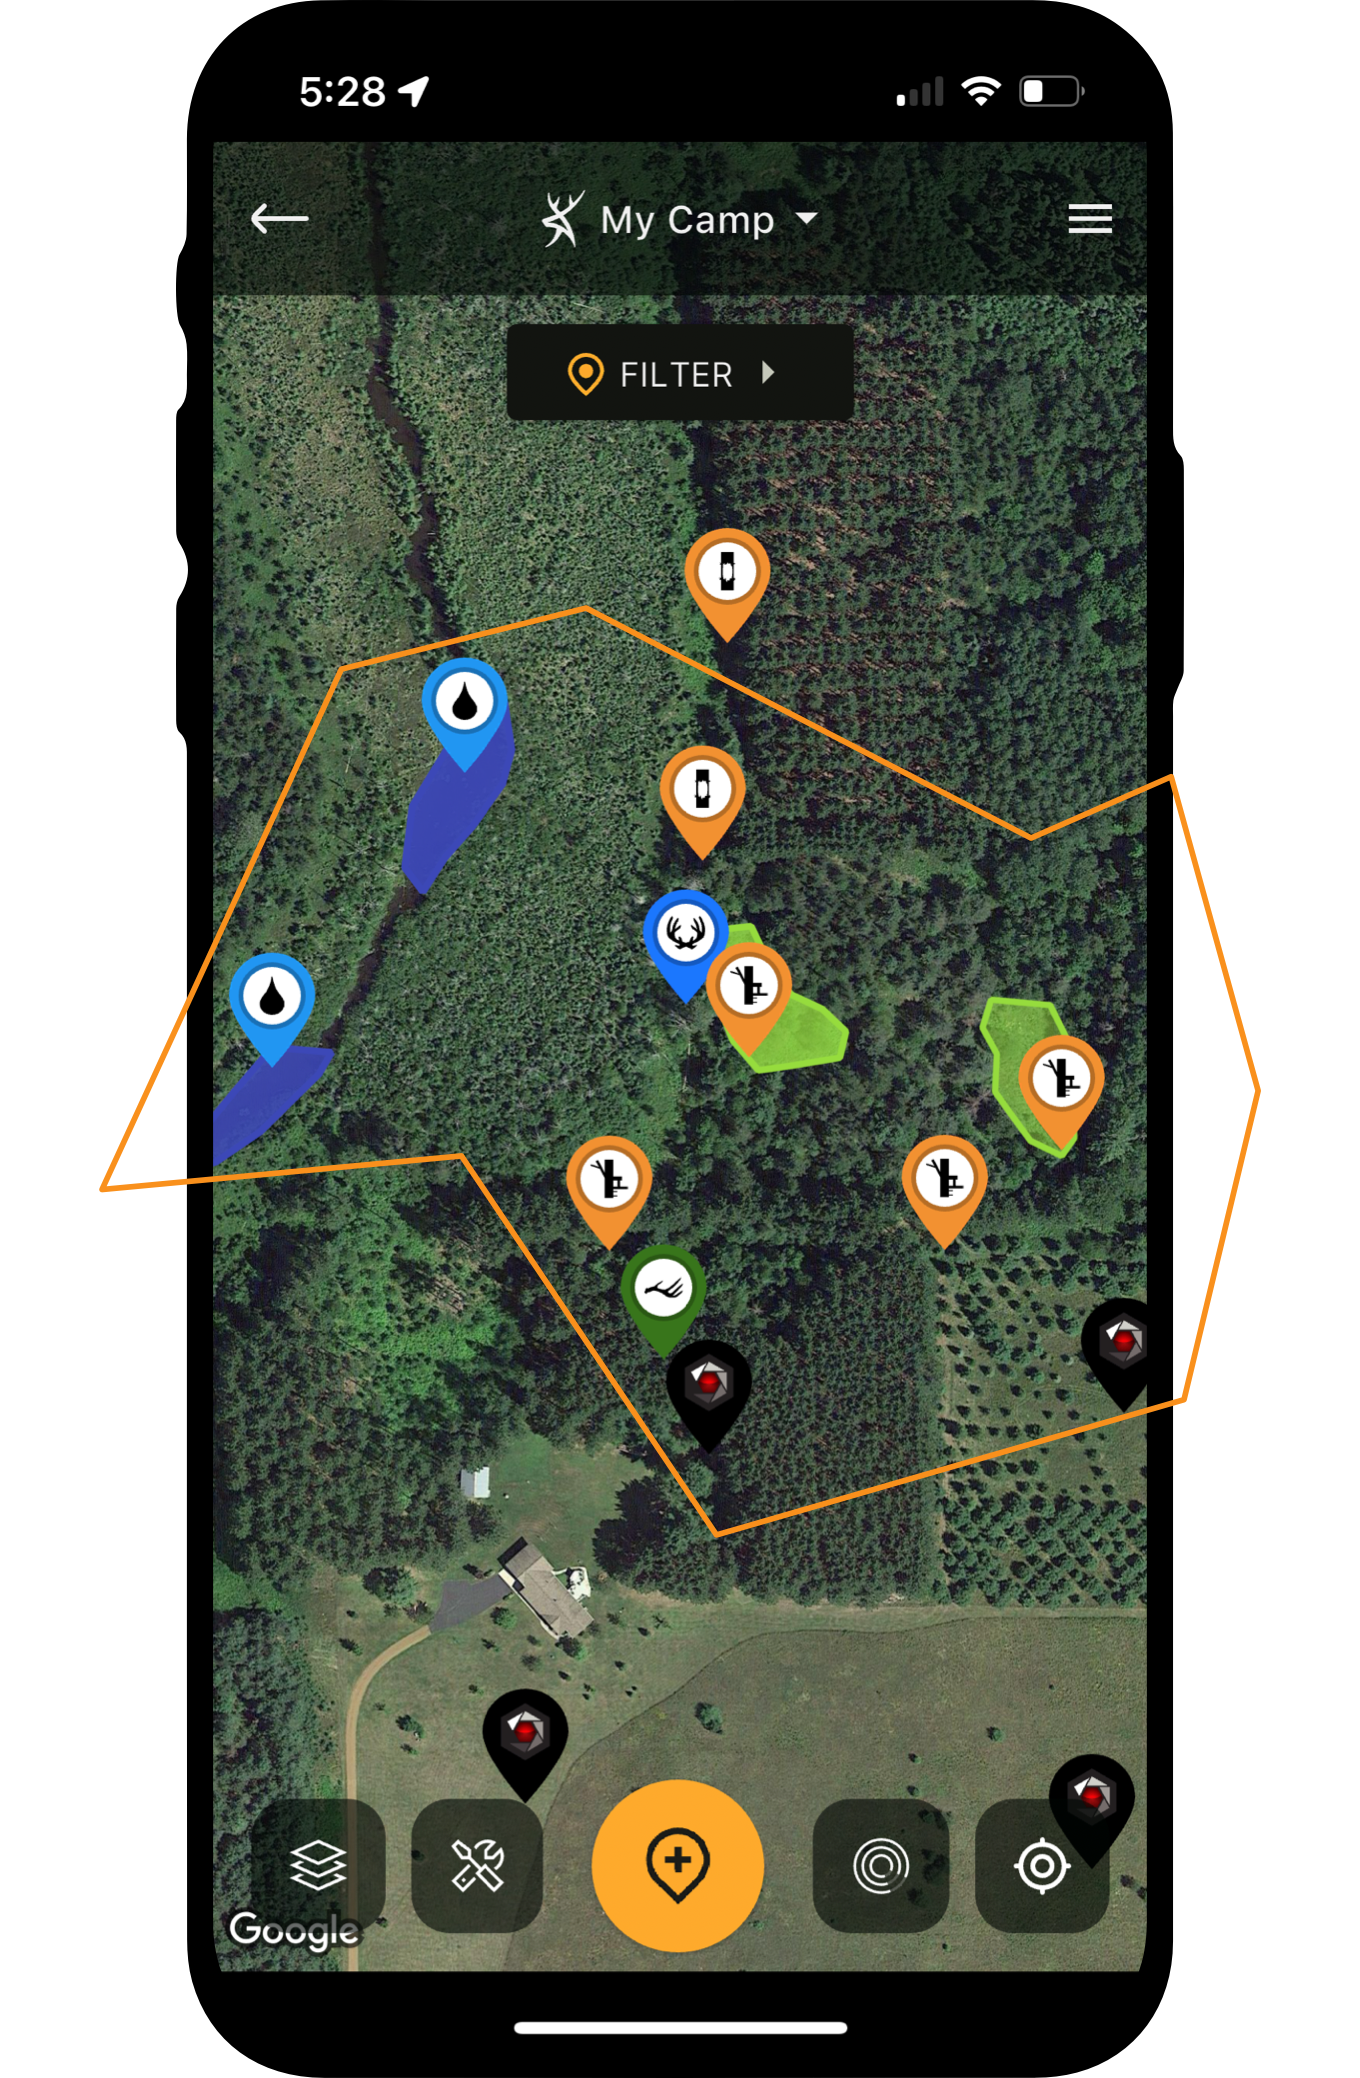
Building a Hunt Area in HuntStand [Deer Dirt]
How It Works
The Whitetail Activity Forecast works in conjunction with individual “Hunt Areas” within the HuntStand app. After a hunter has selected a particular hunt area, they can engage this tool to obtain detailed weather and activity information for that area. Once opened, the Whitetail Activity Forecast provides two informative screen views. These detail vital weather, rut, and movement information. In addition, they show the best days and times to hunt a given area during the next seven days.
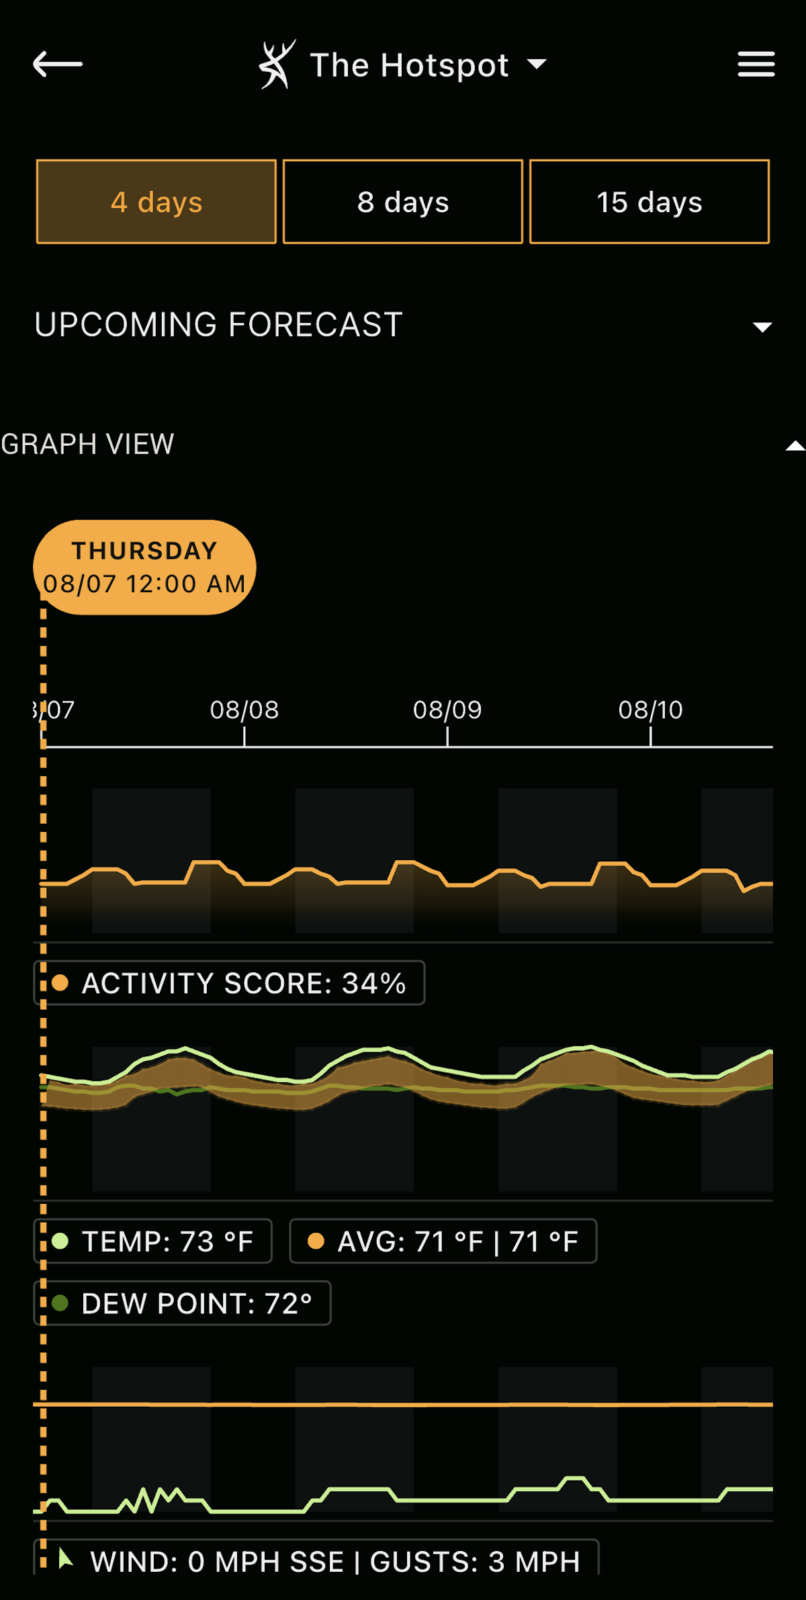
The second screen view (shown above) shows helpful 4-, 8-, and 15-Day Whitetail Activity Charts. Here, a hunter can scroll hour-by-hour over the next 15 days to determine when daytime activity levels will be highest.
The first screen view shows “Today’s Whitetail Activity Forecast” and a “15-Day Whitetail Activity Forecast.” Today’s Whitetail Activity Forecast provides peak morning and evening activity times. It also shows corresponding activity scores (percentages) for the first day of the 15-day period. In addition, it includes a current rut intensity value and a summary of the two-week peak rut dates for that area. The 15-Day Whitetail Activity Forecast provides the peak movement time and associated activity scores for the subsequent 14 days in the forecast.
The second screen view holds the 15-Day Whitetail Activity Charts. Here, a hunter can scroll hour-by-hour over the next seven days — to determine when activity levels will be highest. It is important to note that activity levels stretch from one hour before official sunrise, to one hour after official sunset (i.e., not at night).
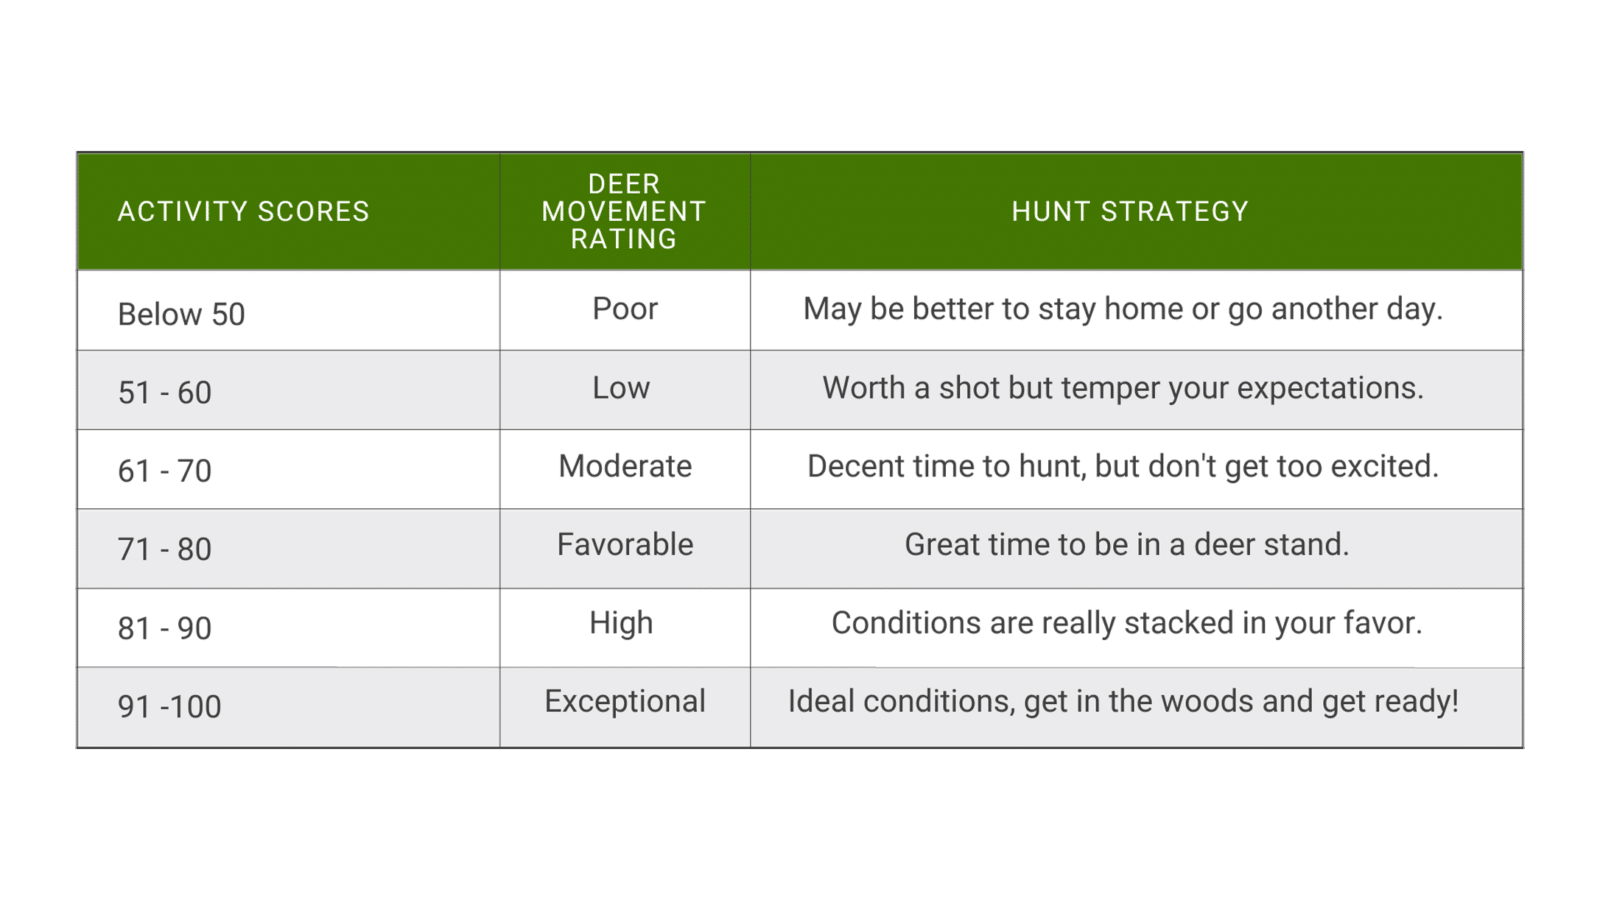
Deer activity scores of 80% or higher are considered excellent; anything above 90% is considered optimal, with high deer movement likely.
Featured below the activity meter are several charts showing hourly changes in several key environmental factors. Those factors include temperature, dewpoint, wind speed, barometric pressure, humidity, precipitation, and cloud cover. Together, these charts provide hunters everything they need to know regarding expected weather conditions during a particular hunting period.
Whitetail Rut Map : A HuntStand Exclusive Feature
Deer Activity Scores
As noted above, deer activity scores appear as percentages, and directly correlate to the conditions impacting deer movement. This percentage is based on a maximum score of 100. That score would only be possible during the rut, when every environmental variable was optimum. For example, an activity score of 65% means that 65% of all possible conditions are favorable for deer movement. Scores of 80% or higher are excellent. In addition, anything above 90% is optimal, with high deer movement likely. Below is a general guide to expected deer movements relative to activity scores.
Important Considerations for Hunting:
A. Low activity scores do not mean that hunting will be unproductive. Regardless of conditions, deer must move to eat, avoid predators, and interact socially with other deer in the area. However, higher scores suggest higher activity levels — which increases your chances of success.

“What makes the Whitetail Activity Forecast and Whitetail Rut Map tools so unique is their basis in science, and their ability to provide detailed site-specific information. There is simply nothing like either product on the market today.”

Brian Murphy
HuntStand Staff Wildlife BiologistB. Users should keep in mind that while a specific date/time may have the highest activity score of a given week, other days also may have high scores and be great times to hunt. For example, the highest activity score for a given day during the upcoming week might be 87%. And let’s say the other days of that week have scores above 80%. What does it mean? Well, all of those upcoming days are great times to hunt.
It's wise to check activity scores frequently, especially during periods of approaching or passing weather fronts. As weather conditions and forecasts change, so too will activity scores.
C. Users should check activity scores frequently, especially during periods of unsettled conditions and approaching or passing weather fronts. This is because scores calculate in real-time, using current and predicted weather conditions. As weather conditions and forecasts change, so too will activity scores. So, just as when considering a rainfall forecast tomorrow versus a week from now, the most-current forecast is typically the most accurate.
Find Better Deer Stand Sites with HuntStand Pro
Whitetail Activity Forecast: Bottom Line
When you check the science and crunch the numbers, you’ll find successful hunting is truly a game of odds. Better news? HuntStand’s Whitetail Activity Forecast stacks the odds in your favor. That’s because we built it using a comprehensive set of deer-movement variables, backed by decades of scientific research.
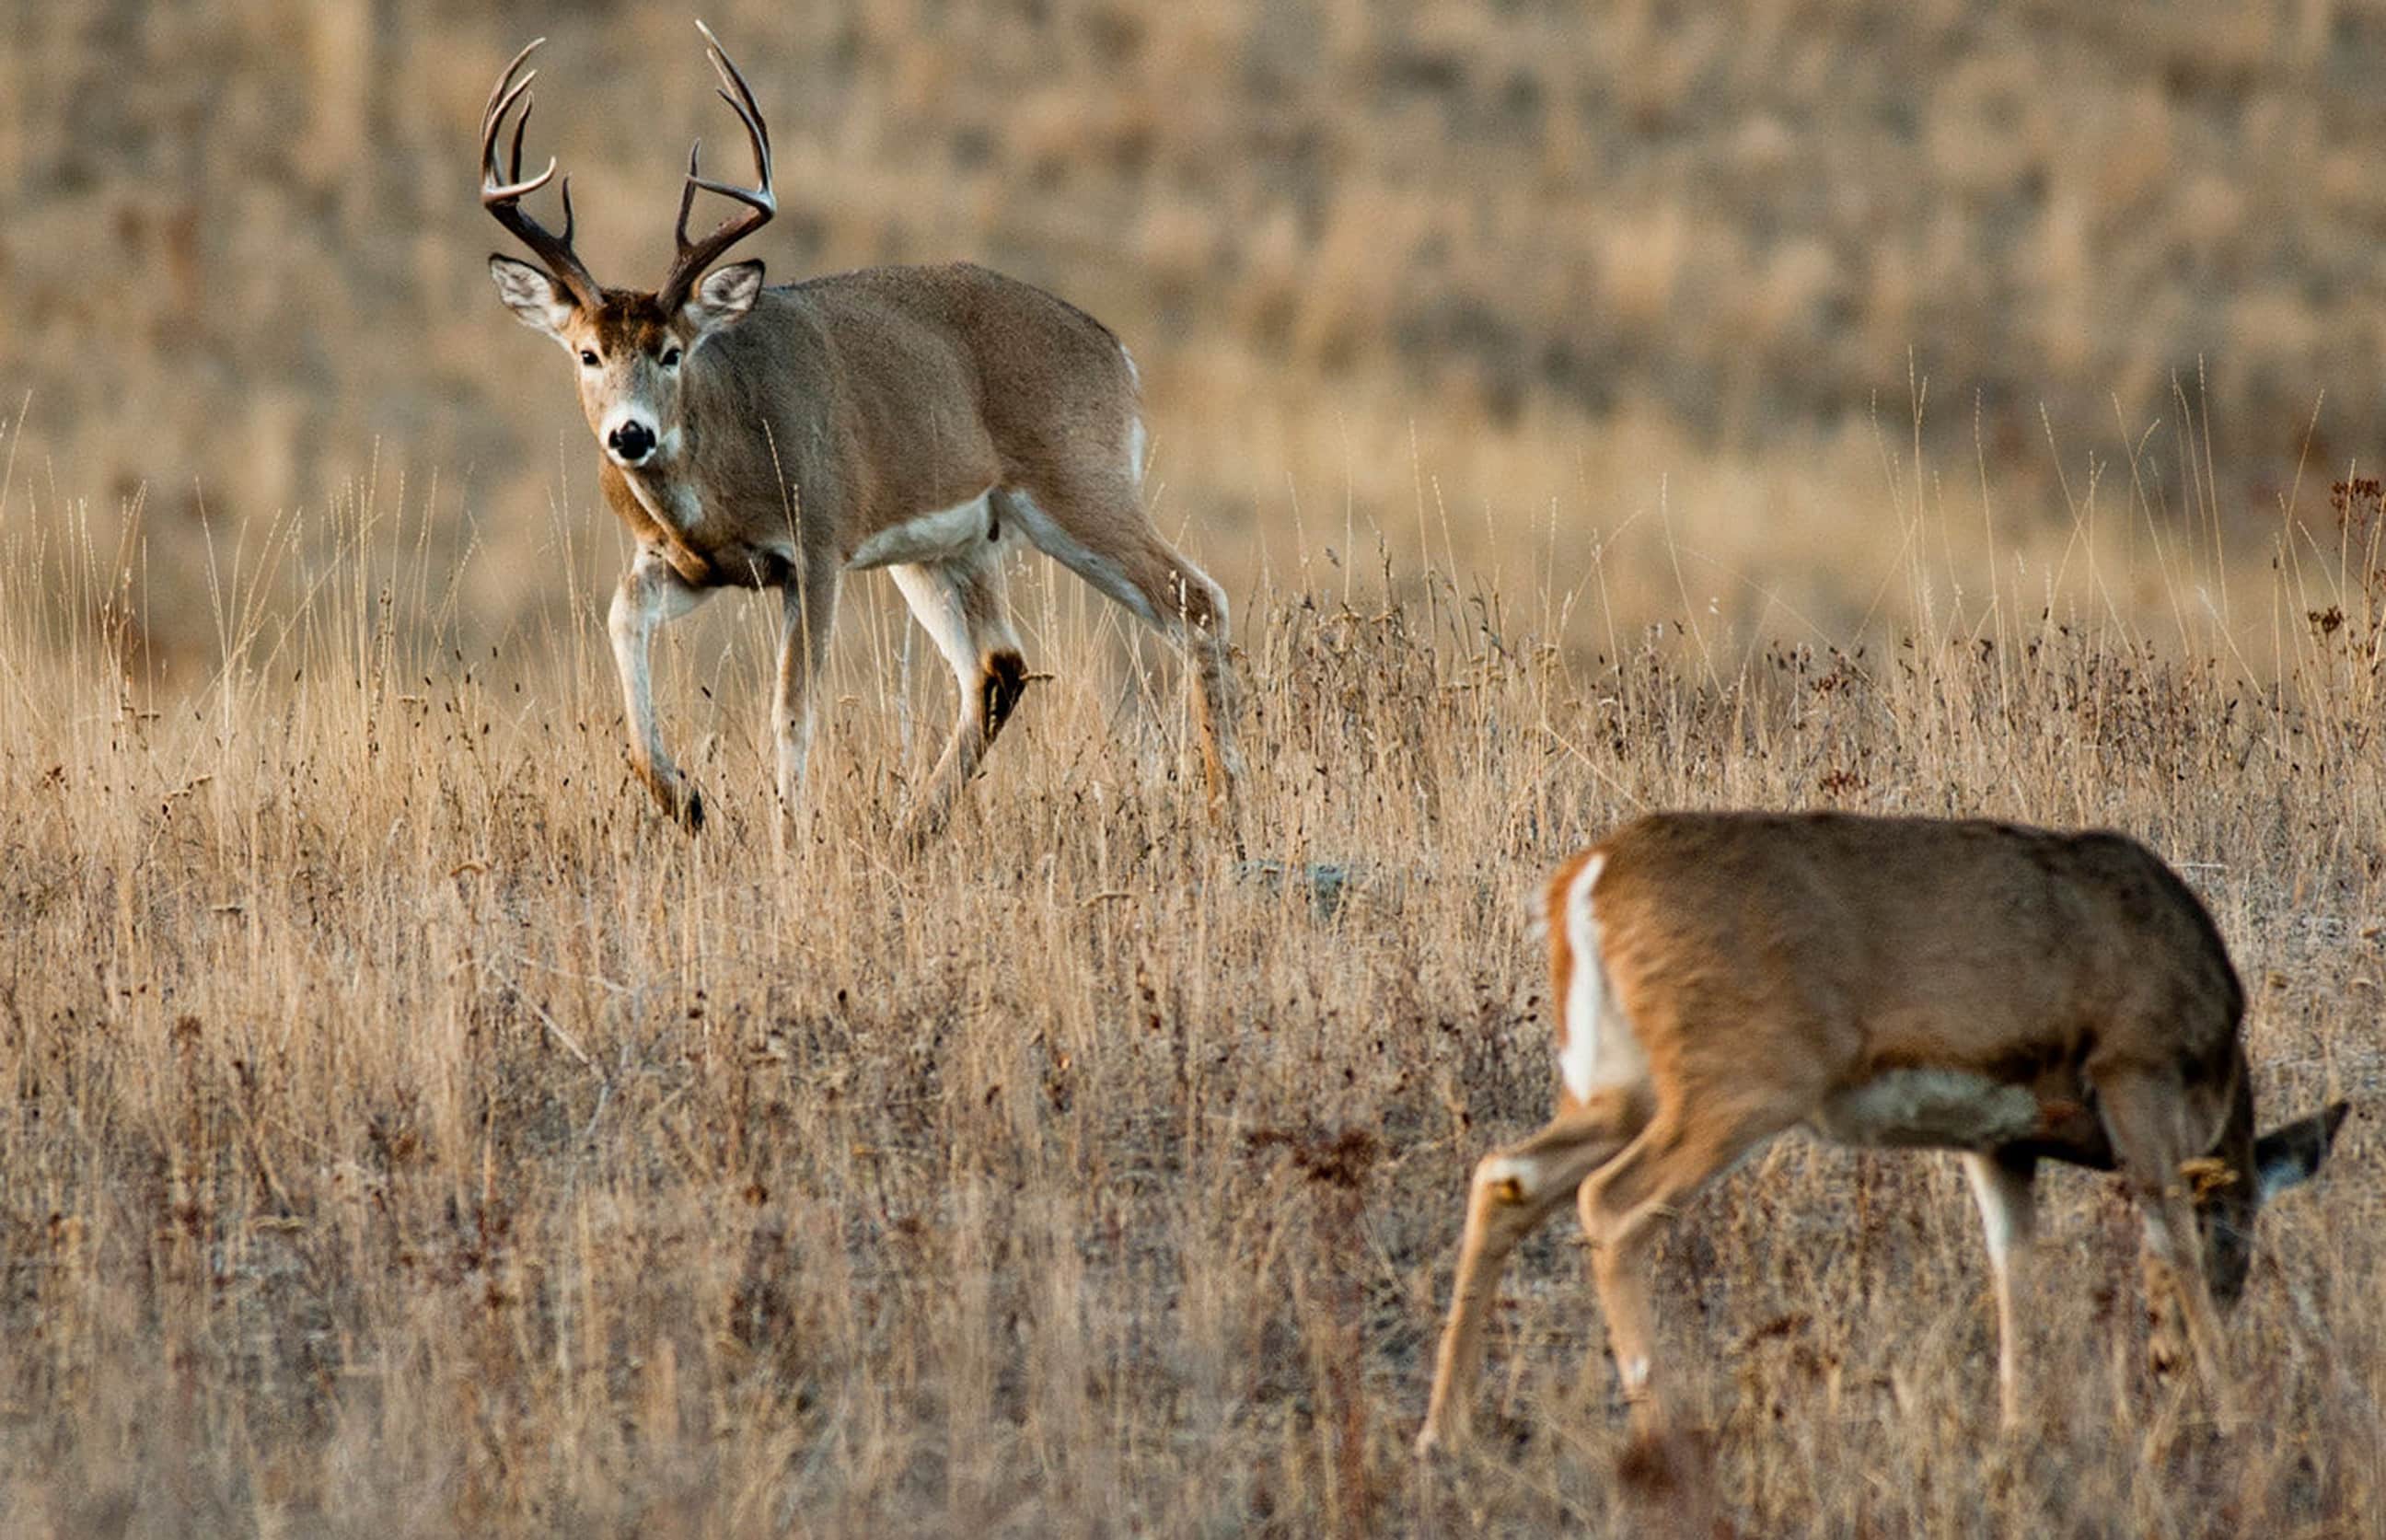
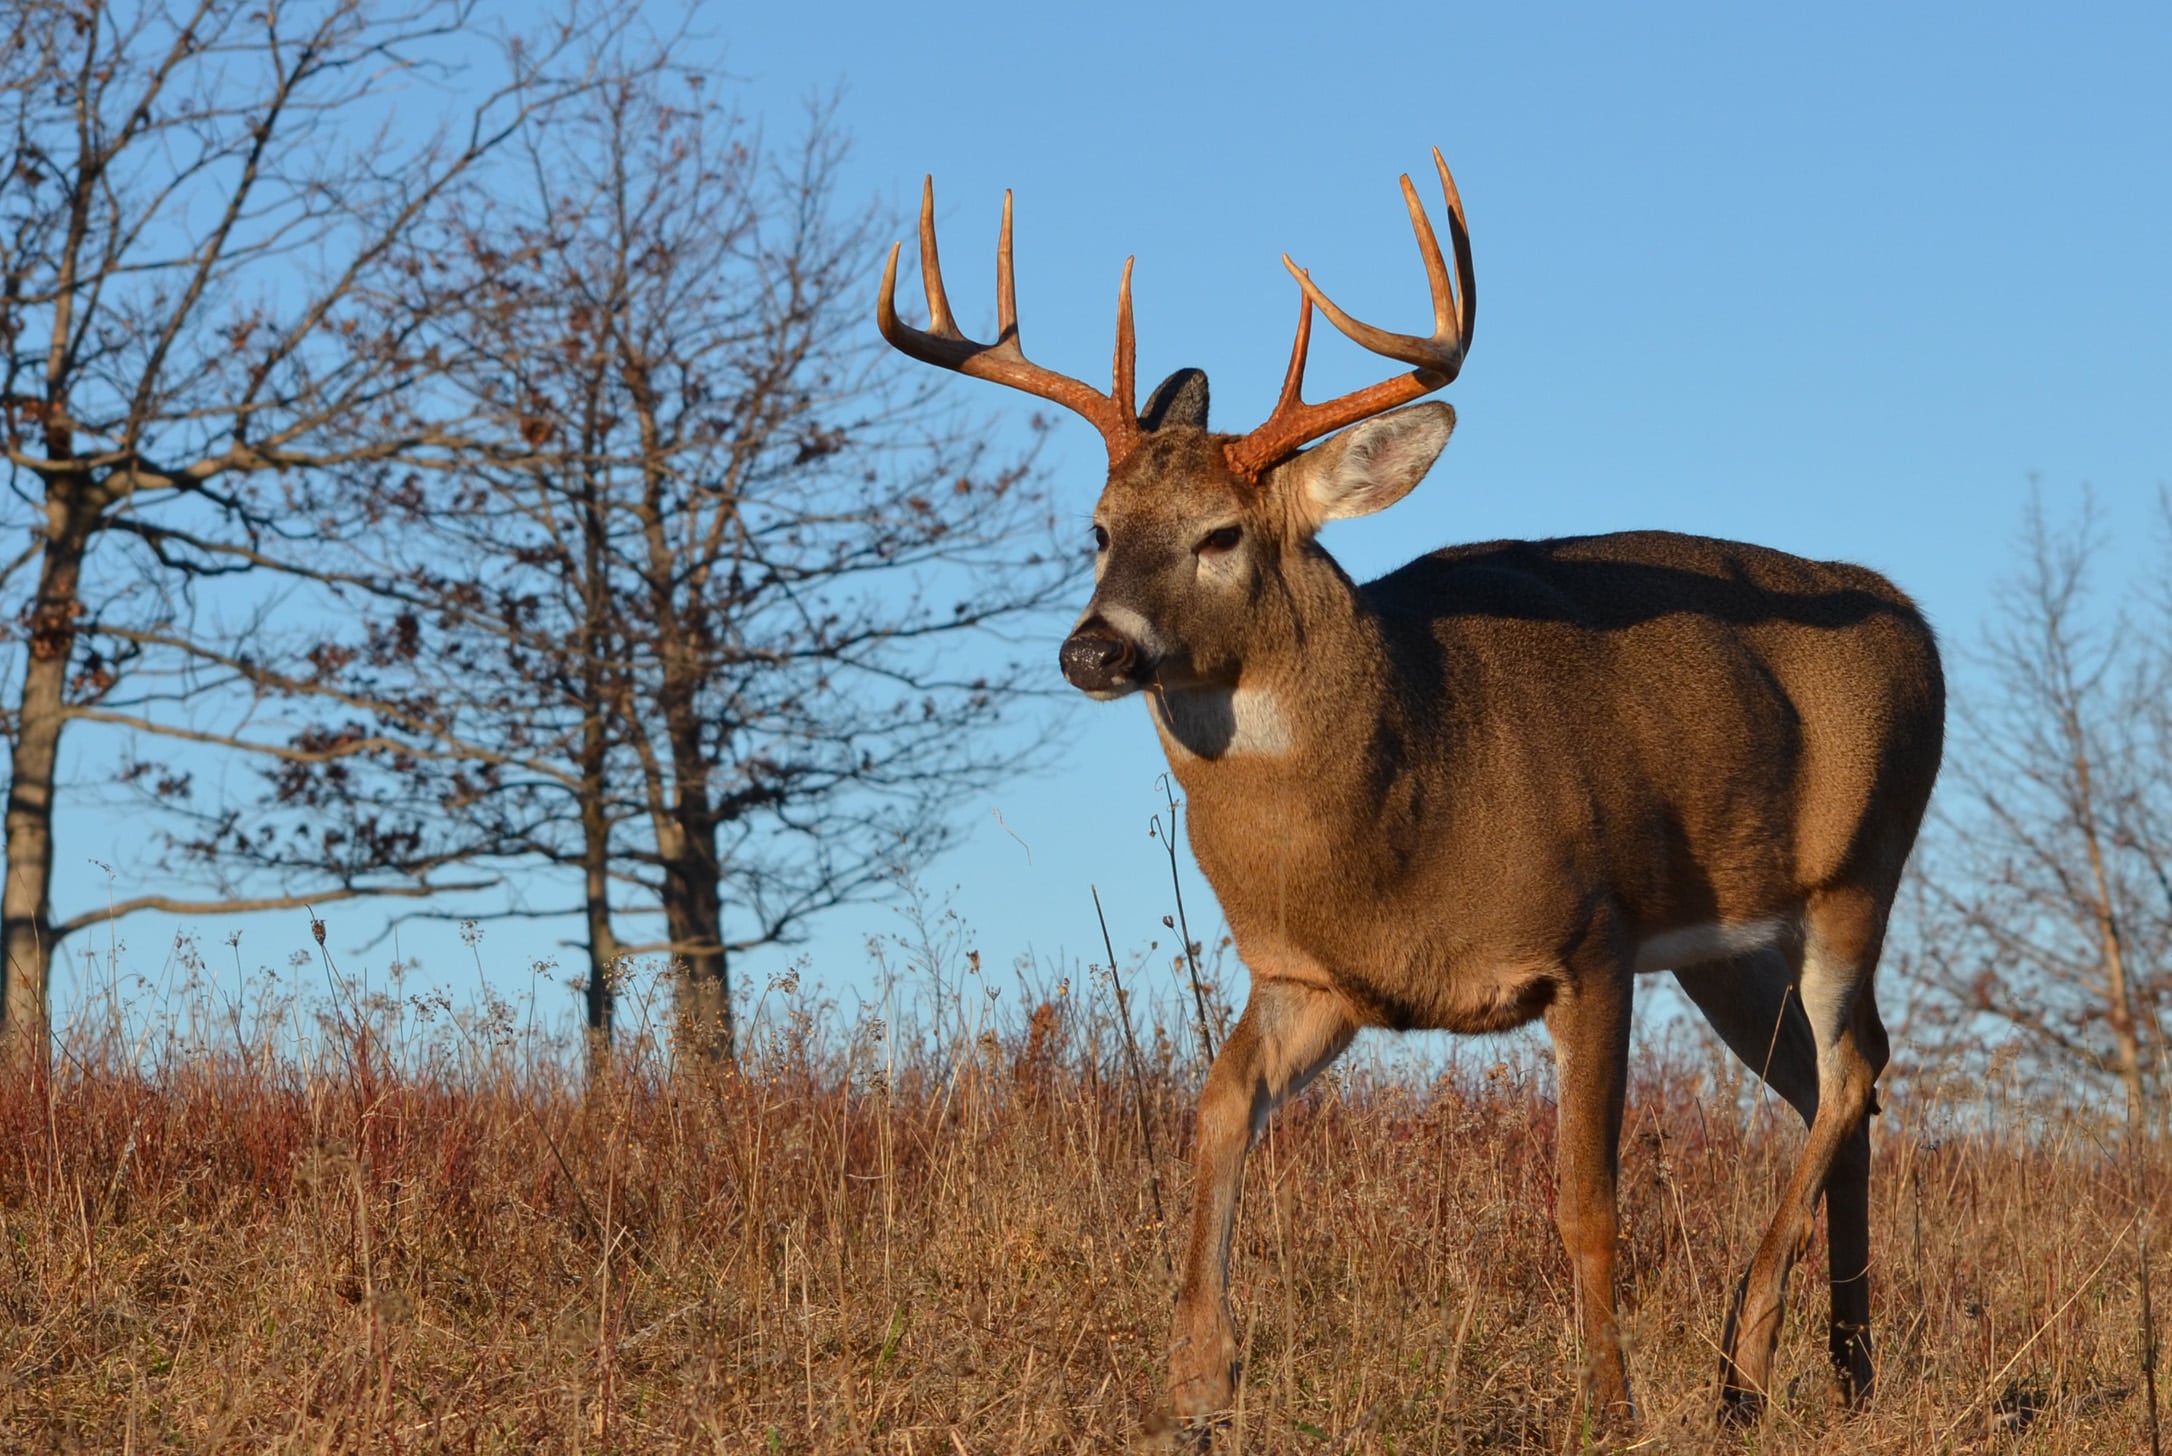
Successful deer hunting is a game of odds, and HuntStand’s new Whitetail Activity Forecast helps stack the odds in your favor.
If you’re looking to increase hunting success, this exciting tool is a true game changer. And it’s just one component of the HuntStand Ultimate upgrade. If you’d like to up your whitetail game, do yourself a favor and upgrade today.